Kubernetes is widely used as a hosting platform in any kind of IT infrastructure where applications are designed, developed and deployed using distributed microservice based architecture. In a microservice based architecture each of the services are designed to be running in a container which in turn runs inside the basic execution unit in a Kuberntes called Pods.
Since the main agenda of this post is to discuss how the applications scale with increase in load and user traffic, I am not going into much details about the working of a Kubernetes cluster in general. There are many such materials available online which can be referred to.
We just need to understand the basic working components of a Kubernetes like containers, pods, deployments, replicas, worker nodes, control plane, services, ingress, HPA etc. in order to follow along with the contents of these posts. Though these components are common in any kind of Kubernetes implementation, however our focus here in this article would be on Azure AKS, hence some understanding of AKS is essential along with some Azure cloud resources like Application Gateway, AKS Public/Private cluster setup, Node Pools etc.
https://learn.microsoft.com/en-us/azure/aks/concepts-clusters-workloads
Applications are deployed on Kubernetes mostly as deployments which contain multiple replicas of a pod. Each replica is scheduled/placed on a compute device which we call worker nodes, by the control plane component called the scheduler. Since we are referring to Azure AKS which is a Azure Managed Kubernetes cluster, here in this article, the control plane is Azure managed.
Applications are deployed on a Kubernetes cluster in multiple layers and each layer is encapsulating the details of the underlying layer from the above layers. Kubernetes cluster is a very highly flexible platform. Each component can be configured, tuned and managed independently as per the requirement. Though Kubernetes provides lots of flexibility in configuring, tuning the cluster as per our requirement, it’s a bit complex to manage. Hence understanding how each component of a Kuberntes is very crucial while designing, deploying and managing the cluster and in this molding it as needed.
Kubernetes provides inbuilt load balancing and scaling possibilities natively within the cluster itself which we can leverage as par our requirement. Control plane is the most crucial component in a Kubernetes cluster which in turn controls how applications will be scheduled to be deployed and it also maintains the state of the cluster in its key-value store which is called as “etcd” which acts as a state database. Kubernetes also captures resource utilization data and stores it in its metric server.
In order to facilitate additional user traffic and load, auto scaling can be performed in two ways:
- Pod level scaling
- Node level scaling
Pod level scaling
Let’s discuss Pod level scaling first. Pod level scaling in Kubernetes can be performed as a horizontal scaling mechanism configured through a Kubernetes resource called HPA (Horizontal Pod Autoscaler). HPA works on the basis of memory and cpu resource requests raised by the pods as per its current utilization as against resource limits set per pod in the deployment.
Every deployment resource in a Kubernetes has been configured with per pod memory and cpu resource limits set so that the utilization of the pods does not consume the entire resources available in the underlying compute nodes.
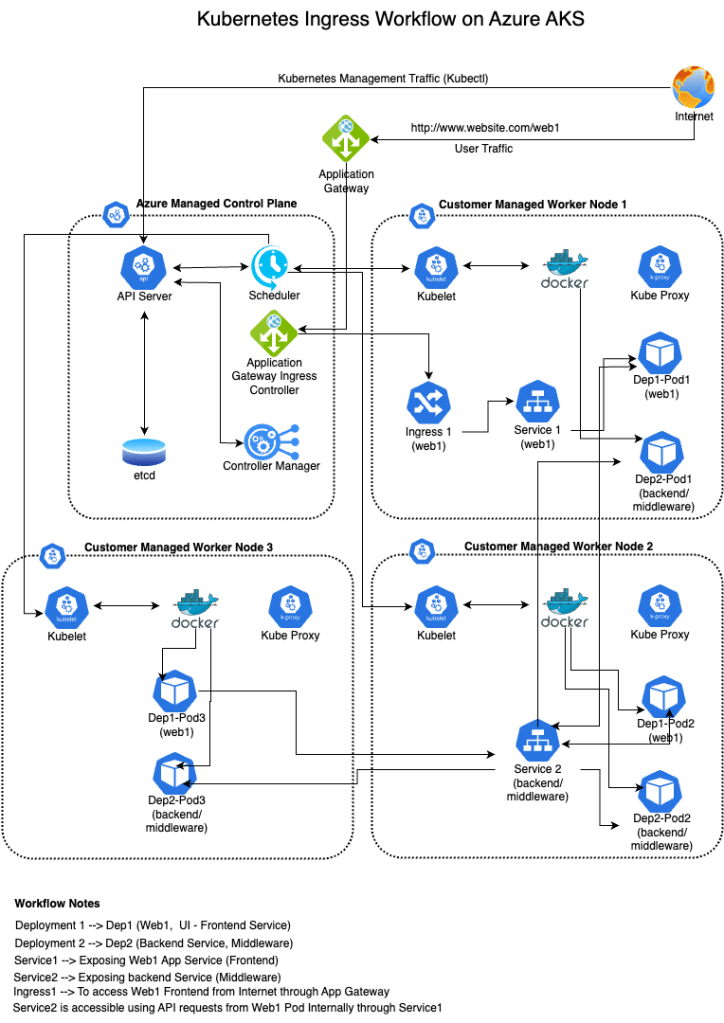
In Kubernetes, pods for a particular deployment are distributed and placed on multiple worker nodes in order to maintain high availability and fault tolerance i.e. remove single point of failure. User requests received through the ingress are load balanced by the service and distributed to the respective active healthy pods for processing.
Each pod of a deployment for a particular application service (microservice) is called replicas and we define a minimum number of replicas “replicas: 3” (Refer to below mentioned sample deployment yaml) to be running for each application at all times in the deployment configuration itself. However, that’s a manual configuration and the respective value has been calculated on the basis of expected user connections/load to be received by the application.
apiVersion: apps/v1
kind: Deployment
metadata:
  name: nginx-deployment
  labels:
    app: nginx
spec:
  replicas: 3
  selector:
    matchLabels:
      app: nginx
  template:
    metadata:
      labels:
        app: nginx
    spec:
      containers:
      - name: nginx
        image: nginx:1.14.2
        resources:
          requests:
             memory: "64Mi"
             cpu: "250m"
          limits:
             memory: "128Mi"
             cpu: "500m"
        ports:
        - containerPort: 80
What happens when all of a sudden additional traffic arrives due to any reason, say any kind of black friday sale or festive offers? Does the existing configuration which was configured considering regular expected user traffic, be able to handle the additional load? The answer is, it may be able to handle if sufficient resources are available or may not be able to handle the additional load due to resource constraint or limitations.
In order to provide healthy and efficient user experience, the architecture should be able to scale and handle the additional surge traffic. In case the minimum number of replicas are not able to handle the additional requests, the number of replicas to be increased. Manual increase is always possible using kubectl commands like “kubectl scale –replicas=3 deployment/demo-deployment“, however that takes time because somebody has to monitor the environment continuously to identify such events and take action. This manual process is highly inefficient and impractical.
In such a situation HPA comes to our rescue. In order to implement HPA, we need to first define resource limits and requests in the deployment configuration yaml under the “Spec” section like:
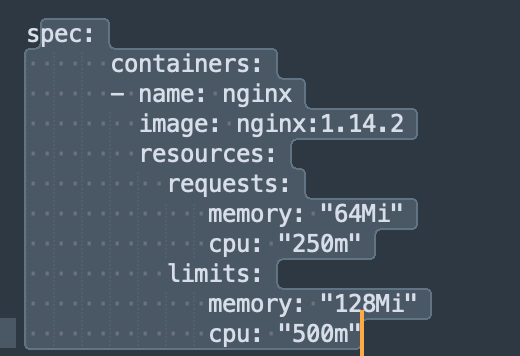
Now lets understand what is the difference between “requests” and “limits”. Limits refers to the maximum resource from the underlying compute, a pod is allowed to utilize i.e. CPU in milicore and memory in MB or GB, a pod can utilize. Here in the above example 1000m means 1 full CPU core and 250m means one fourth of the CPU core and 500m means half of the CPU core has been allocated to the respective pod whereas 128Mi means 128 MB has been allocated to the pod as part of max memory limits.
Requests means what is the newer current resource requests raised by the pods in order to serve all the user connections including the newer ones. It determines how much CPU and Memory resources are required by the pods to serve the allocated number of connections including the new connections waiting to be served. Value mentioned in the deployment yaml is requested when new pod has been spinned off for the first time. Then Kubernetes resource metrics API is used to assess the actual utilization of the pods continuously and stores the information to be used by other services/resources like HPA to assess the situation and take action.
Horizontal Pod Autoscaler (HPA) automatically adds or removes pod replicas. This makes it possible to automatically manage workload scaling when the level of application usage changes.
Horizontal scaling means that the response to increased load is to deploy more pods. This is different from vertical scaling, which for Kubernetes would mean assigning more resources (for example: memory or CPU) to the Pods that are already running for the workload.
Kubernetes implements horizontal pod autoscaling as a control loop that runs intermittently (it is not a continuous process). The interval is set by the --horizontal-pod-autoscaler-sync-period parameter to the kube-controller-manager (and the default interval is 15 seconds).
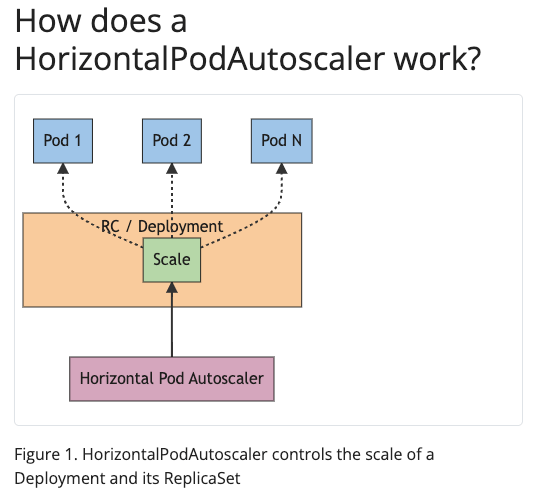
Note: The above image and text in the screenshot has been taken from kubernetes.io documentation page.
Once during each period of 15 seconds of control loop, the controller manager queries the resource utilization against the metrics specified in each HorizontalPodAutoscaler definition.
In order to implement HPA, we have to define an HPA controller resource using a similar kind of yaml manifest sample given below. In the given yaml manifests, we have to define the minReplicas and maxReplicas values which overrides the minimum value defined using deployment yaml or manual scaling done if any earlier using kubectl command line etc.
We also need to define a target for CPU and Memory resources. One point to note is that targets are set on average utilization values because in each deployment there are multiple pod replicas running. HPA does not work on the individual pods, instead it works on the entire deployment itself which is a collection of replicas i.e. pods. One more point to note is that the HPA works on actual/current utilization of resources utilized by the pods as captured by Kubernetes resource metrics API as against the requests made for allocation of additional resources. Here in the example target CPU is defined as a percentage and memory is defined in value. Both can be defined as a percentage as well.
apiVersion: autoscaling/v2
kind: HorizontalPodAutoscaler
metadata:
  name: nginx
spec:
  scaleTargetRef:
    apiVersion: apps/v1
    kind: Deployment
    name: nginx
  minReplicas: 1
  maxReplicas: 10
  metrics:
  - type: Resource
    resource:
      name: cpu
      target:
        type: Utilization
        averageUtilization: 50
  - type: Resource
    resource:
      name: memory
      target:
        type: AverageValue
        averageValue: 100Mi
HorizontalPodAutoscaler can be created using kubectl command line tool as well as mentioned below:
kubectl autoscale deployment nginx –cpu-percent=50 –min=1 –max=10
Here in this example for per-pod resource metrics (like CPU), the controller fetches the metrics from the resource metrics API for each Pod targeted by the HorizontalPodAutoscaler. Then, if a target utilization value is set, the controller calculates the utilization value as a percentage of the equivalent resource request on the containers in each Pod. The controller then takes the mean of the utilization or the raw value (depending on the type of target specified) across all targeted Pods, and produces a ratio used to scale the number of desired replicas.
For per-pod custom metrics like memory in the above example, the controller functions similarly to per-pod resource metrics, except that it works with raw values, not utilization values. That is If a target raw value is set, the raw metric values are used directly. Refer to the algorithm details section below for more information about how the autoscaling algorithm works.
Note: If some of the Pod’s containers do not have the relevant resource request set, CPU utilization for the Pod will not be defined and the autoscaler will not take any action for that metric.
The common use for HorizontalPodAutoscaler is to configure it to fetch metrics from aggregated APIs (metrics.k8s.io, custom.metrics.k8s.io, or external.metrics.k8s.io). The metrics.k8s.io API is usually provided by an add-on named Metrics Server, which needs to be launched separately. Azure AKS deploys its metric server in its default implementation.
Algorithm details
From the most basic perspective, the HorizontalPodAutoscaler controller operates on the ratio between desired metric value and current metric value:
desiredReplicas = ceil[currentReplicas * ( currentMetricValue / desiredMetricValue )]
For example, if the current metric value is 200m, and the desired value is 100m, the number of replicas will be doubled, since 200.0 / 100.0 == 2.0 If the current value is instead 50m, you’ll halve the number of replicas, since 50.0 / 100.0 == 0.5. The control plane skips any scaling action if the ratio is sufficiently close to 1.0 (within a globally-configurable tolerance, 0.1 by default).
When a targetAverageValue or targetAverageUtilization is specified, the currentMetricValue is computed by taking the average of the given metric across all Pods in the HorizontalPodAutoscaler’s scale target.
Let’s take a realistic example below and understand the HPA configuration and state of the mentioned microservices under the control of HPA.


In the given screen shots of the command “kubectl get hpa” from a realistic client project, look for the values for asset-service and focus on the TARGETS column. First block value i.e. 83%/114% is the memory targets and second block of 5%/200% refers to CPU targets. Here 83% is the current average memory request value for all the replicas running including the newer connections which is lower than the defined target or desired target i.e. 114% in our case. Hence the number of replicas running is the same as MINPODS value i.e. 3. For CPU, 5% is the current average CPU request value for all the replicas running including the newer connections which is lower than the defined target or desired target i.e. 200% in our case. Since both CPU and Memory requests are within the desired targets, no scaling happening. It can scale up to the MAXPODS value of 10 in case necessary.
More details about specific HPA for a deployment can be checked and issues can be troubleshooted using the command “kubectl describe hpa <deployment_name>“.
For example: kubectl describe hpa catalog-service
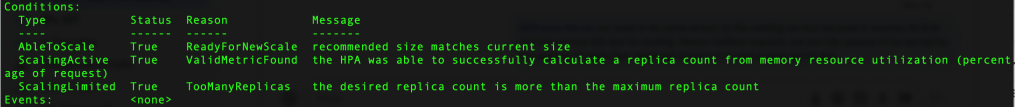
Then look for the sections Metrics, Conditions and Events for for more details.
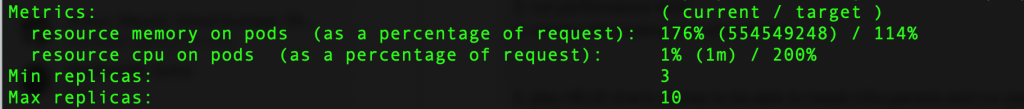
Note: In any case the average resource requests should not exceed the average resource limits defined for the deployment. In case resource utilization for any specific pod increases for any reason, say due to memory leak or faulty application code, the pod gets into an error state and would be terminated and replaced by the Kubernetes auto healing policy. All connections would be dropped which might generate http 5xx error codes and newer requests would be distributed to the other running pods.
Let’s look at two more services, cart-service and catalog-service in the above screen shots where scaling happens due to high memory requests 75%/70% and 116%/114%. CPU requests are within target. In both services actual replicas running are higher than the MINPODS. They are still within the MAXPODS limit.
Note: Once the scaling reaches the MAXPODS limit, no further scaling happens and newer connection requests would have to wait in queues to be served.
What happens if the requirement is to set the MAXPODS value to a higher value in order to support a very high volume of traffic however the underlying worker nodes are not able to meet the resource requests?
In such a scenario, we can increase the number of worker nodes configured in the respective node pool which we can call Node level scaling. This can be configured by setting the minimum and maximum number of nodes value in a node pool configuration. The drawback is, it involves additional compute costs while adding additional worker nodes in the pool.
Node level scaling in Azure AKS using cluster autoscaler:
To keep up with application demands in Azure Kubernetes Service (AKS), you might need to adjust the number of nodes that run your workloads. The cluster autoscaler component watches for pods in your cluster that can’t be scheduled because of resource constraints. When the cluster autoscaler detects issues, it scales up the number of nodes in the node pool to meet the application demand. It also regularly checks nodes for a lack of running pods and scales down the number of nodes as needed.
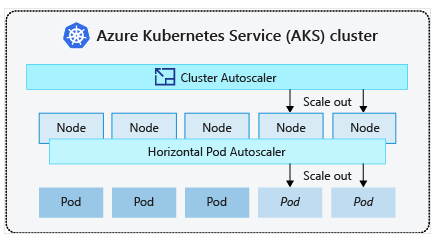
The Horizontal Pod Autoscaler scales the number of pod replicas as needed, and the cluster autoscaler scales the number of nodes in a node pool as needed. The cluster autoscaler decreases the number of nodes when there has been unused capacity after a period of time. Any pods on a node removed by the cluster autoscaler are safely scheduled elsewhere in the cluster.
The cluster autoscaler can be enabled using azcli command line tool, Azure console or Terraform etc as needed.
az aks update –resource-group myResourceGroup –name myAKSCluster –enable-cluster-autoscaler –min-count 1 –max-count 3
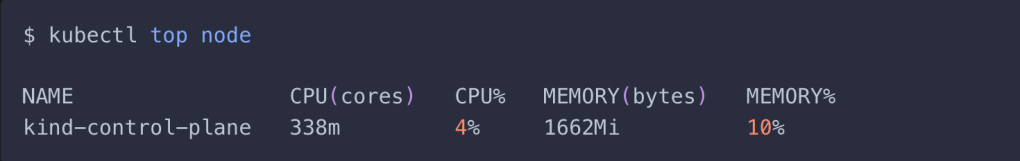
Worker nodes resource level can be checked from the Azure AKS console or using kubectl command line tool using the command “kubectl top node“
Is it a good idea to enable node level autoscaling using cluster autoscaler in Azure AKS?
Enabling node level autoscaling in Azure AKS without proper planning is a very dangerous and risky proposition because it involves additional costs. Instead of adding additional nodes through autoscaling, we should focus on selecting the right sizing of VM instances as per our requirement that fulfils the resource requests raised from the pods on a regular basis. If the HPA is tuned properly and underlying number worker nodes would be able to meet the resource requests, then the Kubenetes cluster would be able to handle very large number user traffic without much performance degradation even without adding additional worker nodes.
Considerations for selecting right sizing of the VM instances to be used as worker nodes:
- If the applications to be deployed are supposed to consume more memory, then go for memory optimized instances. Select instances with more memory and less CPU.
- If the applications to be deployed are supposed to consume more CPU, then go for CPU optimized instances. Select instances with more CPU cores and less memory.
- If the applications to be deployed are supposed to consume both CPU and Memory, then go for general purpose instances which mostly provide balanced compute capabilities.
- In case applications to be deployed are designed using Java based framework, then it is always advisable to go for memory optimized instances. Java based applications are known to consume more memory and OOM situations happen very frequently.
- If the applications to be deployed are data processing intensive then it is advisable to go for CPU optimized instances. At the same time choose an instance with sufficient memory and storage in order to handle data input/output efficiently.
- Wherever possible go for AMD based instances because AMD processors provide good processing power with less costs involved.
- In case the application is meant for batch processing and not impacted by instance termination, then one can consider using additional node pools with spot instances which provides considerable cost saving.
- Just by selecting a proper VM instance sizing does not work of its own. Deployments and HPA configurations to be done properly to set the resource limits and targets as needed.
- In case of new applications where sufficient resource metric data is not available, it is advisable to keep higher resource limits in deployment configurations initially to minimize failures like pod termination/eviction and then after proper stress testing, adjust the Limits accordingly at a later stage.


Leave a comment